If you've drawn widgets with HTML5 canvases, you've no doubt come across such methods as ctx.translate(x, y), ctx.scale(x, y), and ctx.rotate(radians). These are all convenience methods for ctx.transform(a, b, c, d, e, f), which applies a generic affine transform to the canvas. Consulting the specs will show that the a-f variables refer to this transformation matrix:
![]()
If this looks incomprehensible, it might help to express the matrix in basic Algebraic terms:
 x' = ax + cy + e, and
 y' = bx + dy + f
In the above matrix and equations, x' and y' ("x prime" and "y prime" for the maths-averse) are the coordinates to draw to in the viewport (canvas), where plain x and y are coordinates in the source image. Iterate over all the pixels in the source image, run their coordinates through the affine transform, draw them at the (x', y') locations on the canvas, and you have a transformed image. Before we look at what each of the a-f variables does to the image, let's see how we got from the matrix to the Algebra, starting with some basic background.
Dot Product
Dot Products are very easy: Take two lists of numbers, multiply the ones in the same list position, and add up the products. Here's an example, showing the dot product of (1, 2, 3) and (4, 5, 6):
1 * 4 =   4
2 * 5 =  10
3 * 6 = +18
         --
         32
fin. Really, that's it.
Matrix multiplication
As Sal Khan will tell you, the rules for multiplying matrices are completely arbitrary, a cultural invention rather than a natural law. The two rules for multiplying matrices that have been settled on are also fairly simple:
The second rule takes a minute to get your head around: Each number in the product matrix is the dot product of an entire row from one matrix and column from another. If the number in question on the product matrix is in row 5, column 2, it is the dot product of the left matrix's row 5, and the right matrix's column 2. So, in the following matrix equation:
![]()
...the product matrix will be [x', y', 1]:
![]()
...and the two matrices to be multiplied are:
![]()
The left matrix has three rows, and the right has 1 column, as does the product matrix. Calculating dot products from a row and a column works like this:

So, x' will be the dot product of the first row of the left matrix, [a, c, e], and the only column of the right matrix, [x, y, 1]:

The next variable, y', is on the second row of the product matrix, so to find its value we take the dot product of the left matrix's second row, [b, d, f], and again, the only column in the right matrix:

...and we see that the Algebra from above was correct, x' = ax + cy + e, and y' = bx + dy + f. Now, what do these variables all do? Let's do some sample transformations on a picture of my daughter, Adelaide, taking her first dip in the Atlantic at Nag's Head, North Carolina:

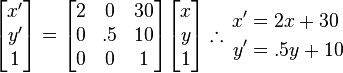
Variables a and d are for scaling. a sets x' to a multiple of x, and d sets y' to a multiple of y. The method ctx.scale(scaleX, scaleY) calls ctx.transform(scaleX, 0, 0, scaleY, 0, 0), giving:
|scaleX       0  0|      x' = scaleX * x + 0y + 0,     x' = scaleX * x,
|     0  scaleY  0|  ->  y' = 0x + scaleY * y + 0  ->  y' = scaleY * y
|     0       0  1|
Setting scaleX to 2, scaleY to .5 gives an image doubled in width, halved in height:

Variables e and f are for offsets (or changing the origin location, however you like to think of it). The method ctx.translate(offsetX, offsetY) calls ctx.transform(1, 0, 0, 1, offsetX, offsetY), giving:
|1  0  offsetX|      x' = 1x + 0y + offsetX,     x' = x + offsetX,
|0  1  offsetY|  ->  y' = 0x + 1y + offsetY  ->  y' = y + offsetY
|0  0        1|
Since canvases have an origin in the upper-left, and coordinates increase going right and down, setting offsetX to 200, offsetY to -200 moves the image to the right and up:

Variables b and c set the shear (slant), because they work on the opposite axis of the variable they apply to. b is multiplied by x to affect y', and c by y to set x'. To keep things simple, we'll just set b to 1 and leave c alone. There is no method ctx.shear or ctx.slant, so we need to call ctx.transform directly. So, ctx.transform(1, 1, 0, 1, 0, 0) (b is bolded) gives:
|1  0  0|  ->  x' = 1x + 0y + 0  ->  x' = x
|1  1  0|  ->  y' = 1x + 1y + 0  ->  y' = x + y
|0  0  1|

In this case, each column of pixels is one more down than the one to its left. When x goes up by one, all the y's on that column also go up by one. This can be combined with a negative y offset to pull the picture up into the canvas more. ctx.transform(1, 1, 0, 1, 0, -200) gives:
x' = x, y' = x + y - 200

We've already accounted for the functions of all the variables; what, then, of rotation? It turns out to be a combination of scale and shear, with some sines and cosines thrown in. If r is the number of radians you wish to rotate a picture, method ctx.rotate(r) calls:
ctx.transform(Math.cos(r), Math.sin(r), -Math.sin(r), Math.cos(r), 0, 0)
This sets the Algebraic transform to:
x' = cos(r)x - sin(r)y
y' = sin(r)x + cos(r)y
To see why this works, let's look at the sine and cosine values for no turn and a quarter turn:
No turn, r = 0
cos(r) = 1, sin(r) = 0
x' = cos(r)x - sin(r)y  -> x' = 1x - 0y  ->  x' = x
y' = sin(r)x + cos(r)y  -> y' = 0x + 1y  ->  y' = y
So, no change. x' = x, y' = y.
Quarter turn, r = pi/2 radians
cos(r) = 0, sin(r) = 1
x' = cos(r)x - sin(r)y  -> x' = 0x - 1y  ->  x' = -y
y' = sin(r)x + cos(r)y  -> y' = 1x + 0y  ->  y' =  x
At a quarter turn, cos(r) is now 0 and sin(r) is 1, effectively swapping x and y. However, if we swapped x and y and left their signs unchanged, we would have an image rotated to the left and reversed. By inverting y's sign before assigning it to x prime, high y's are now low x's. Off the screen x's, in fact. Rotation using this method happens at the origin, and needs to be combined with a translate to scoot the image back into view.
In fact, this is a basic challenge to be aware of when dealing with rotation. Often you will want to rotate an object and draw it in a specific place in an unrotated larger canvas, or have an object that spins on its center. It will take some experimentation to get an intuitive grasp of how the math relates to the final canvas rendering, but in short there are two things to consider: where the center of the object is, and where it will be placed on the canvas. These total two translations.
But let's stop talking about pesky reality and get back to theory. What happens if we aren't rotating a quarter turn, but somewhere in the middle? Let's look at 45 degrees, or pi/4 radians. The following transform:
var r = Math.PI / 4; // 45 degrees
ctx.setTransform(Math.cos(r), Math.sin(r), -Math.sin(r), Math.cos(r), 450/2, -450/4)
...produces this image:

The first thing that should jump out is the offsets: e is set to half the canvas width, where f is set to a quarter of its height (the canvas is square, simplifying things a little). Why were these values required to center the image? Well, it's not perfectly centered, but we'll get to that in a minute. The image is still rotating on its origin point. Consider these pairs of colored boxes with Xs in them; the blue stays stationary, while the red rotates on the origin until it hits 45 degrees:

In the final image, you can see that the center of the red x is on the left edge of the blue image, and three-quarters of the way down. To move it back to the center, it needs to move to the right by half the image width, and up by only a quarter... unless you want the picture perfectly centered, which I wasn't concerned about. It was a visual approximation, but moving up a fifth would have been close. The correct distance would have been √2/2 - .5, or about 0.20710678... (the difference between half the length of the diagonal and half the length of the square's side).
It's interesting to look at some of the numbers used in the rotation. Here's a quick hack to return the same values that ctx.rotate uses, and a few sample inputs:
var r = Math.PI / 4; // 45 degrees
function rotate(x, y) {
  return [x * Math.cos(r) + y * -Math.sin(r), x * Math.sin(r) + y * Math.cos(r)];
}
rotate(0, 0)
[0, 0]
rotate(0, 1)
[-0.7071067811865475, 0.7071067811865476]
rotate(0, 2)
[-1.414213562373095, 1.4142135623730951]
rotate(0, 3)
[-2.1213203435596424, 2.121320343559643]
rotate(0, 4)
[-2.82842712474619, 2.8284271247461903]
rotate(101, 100)
[0.7071067811865674, 142.12846301849606]
rotate(102, 100)
[1.4142135623731065, 142.83556979968262]
rotate(103, 100)
[2.1213203435596597, 143.54267658086914]
rotate(104, 100)
[2.828427124746213, 144.2497833620557]
If you're moving along a horizontal or vertical line, the x and y values both increase (or decrease, depending on context) by the same number: .7071067811865475, or half of √2 (or about that, there is some floating point approximation going on). And since a 45 degree angle makes a 1,1, √2 right-triangle, this makes intuitive sense.
Combining transforms
The method ctx.setTransform sets the current transform explicitly, overriding anything else already going on - you're back to no rotation, offset, shear, or scaling, and then multiply in the matrix of the setTransform call. The initial reset uses setTransform(1, 0, 0, 1, 0, 0), which uses this matrix:
|1 0 0|
|0 1 0|
|0 0 1|
If you're familiar with matrices, you'll recognize this as the identity matrix (or the identity matrix as far as 3x3 matrices is concerned). If you multiply that by any other matrix, you'll get the new matrix back as the product. For example:
|1 0 0|   |1 2 3|   |1 2 3|
|0 1 0| * |4 5 6| = |4 5 6|
|0 0 1|   |7 8 9|   |7 8 9|
Consider the product matrix's 8 value in the third row, second column. That is the dot product of the left matrix's third row, [0, 0, 1] and the right matrix's second column, [2, 5, 8]:
0 * 2 =  0
0 * 5 =  0
1 * 8 = +8
         -
         8
The 1s of the identity matrix are positioned strategically to only evaluate the significant digit from the other side of the dot product. It also works if the identity matrix is multiplied on the right side instead of the left, but I'll leave it to you to find out why, if you're so moved.
If you want to apply an additional transform to one that's already present, like adding a scale to an offset, the method ctx.transform(a, b, c, d, e, f) will multiply the matrix
|a c e|
|b d f|
|0 0 1|
...against whatever transform is already active, and the result will be this:
![]()
Here's the same image with a couple items highlighted to show what rows and columns were used in the dot product:
![]()
With this example, it becomes evident what the bottom [0, 0, 1] row is useful for: it lets the translate variables, e and f, come into play without being multiplied against x or y.
Now, let's say we want to combine a ctx.scale(2, .5) with a ctx.translate(15, 20). The scale maps to ctx.transform(2, 0, 0, .5, 0, 0), and the translate maps to (1, 0, 0, 1, 15, 20). Multiplying the corresponding matrices gives:

Taking the product matrix and plugging it into the Algebra conversion gives:
The end result is the scale stays the same, and the offset gets modified, doubling the horizontal, and halving the vertical, as you'd expect.
Scaling: overcoming built-in interpolation
The last item I'll leave you with is this: the math described for scaling needs a little nudge to work as the user expects it to. What happens if we double x and y? By the affine transformation rules, each pixel of the source image is mapped to the viewport two pixels away from its adjacent neighbors, leaving a grid of empty spaces. Needless to say, this isn't the optimal mapping.
To make scaling more sensible, canvas engines compensate using various interpolation methods, varying with the engine, and some engines have a variety of image rendering modes that can be set with css rules, e.g.
<style> canvas: { image-rendering:optimize-contrast; } </style>
If I take a very simple image of a 10-pixel diagonal line:

...and scale it to (8, 8), my browser of choice, Chrome, renders this:

If I take that and magnify it (a true zoom):

...I can see the basic algorithm in use has indeed spaced the source pixels 8 apart, and then blended with the surrounding colors. The further a pixel is away from the true transformed pixel, the less red it is (and with some weird behavior at the image borders). For photographs that aren't scaled up too much, this will blend some of the pixelation that a true zoom (the "nearest neighbor" interpolation algorithm) would cause.
But what if you want the pixelation? If you wish to use canvases with other HTML5 features to make an image editing web app, you need a way to zoom the image and have it be a true representation, not one that gets blended as you scale up. You need to be able to scale up the line image from before and get this:

Good ol' MS Paint to the rescue.
Unfortunately, at this early stage in the HTML5 game, not all browsers can be forced into this scaling mode. In fact, here is the best cross-browser CSS rule list I could find to even make the attempt:
<style>
  canvas: {
   image-rendering:optimizeSpeed;             /* Legal fallback                 */
   image-rendering:-moz-crisp-edges;          /* Firefox                        */
   image-rendering:-o-crisp-edges;            /* Opera                          */
   image-rendering:-webkit-optimize-contrast; /* Chrome (and eventually Safari) */
   image-rendering:optimize-contrast;         /* CSS3 Proposed                  */
   -ms-interpolation-mode:nearest-neighbor;   /* IE8+                           */
  }
</style>
None of this explicitly declares what interpolation algorithm to use, only that the user is seeking crisp edges, speed, or good contrast. Oddly, IE8 is the sole exception, giving the user the ability to force nearest-neighbor interpolation. My version of Chrome, using WebKit 536.11, hasn't been upgraded in a while. It's possible that this has been fixed in Chrome for Windows by now, but in the version I'm using, nearest-neighbor mode doesn't work, at least not within canvases using ctx.drawImage.
To work around this, I coded up a quick hack at a nearest-neighbor algorithm, which leaves the context scale level at 1, and uses ctx.getImageData and putImageData to work with pixels directly. At the top of this is some stubbed out code to declare the identity matrix and to multiply transformation rules, which I plan to use later as my HTML5 image library grows.
var identity = [1, 0, 0, 1, 0, 0];
var transform = identity;

function multiplyTransforms(t1, t2) {
  var a = t1[0];  var A = t2[0];
  var b = t1[1];  var B = t2[1];
  var c = t1[2];  var C = t2[2];
  var d = t1[3];  var D = t2[3];
  var e = t1[4];  var E = t2[4];
  var f = t1[5];  var F = t2[5];
  return([a*A+c*B, b*A+d*B, a*C+c*D, b*C+d*D, a*E+c*F+e, b*E+d*F+f]);
}

// vp = View Port
var vpZoom = 8;         // Current zoom level
var vpOrigin = [0, 0];  // x,y of source image currently in upper-left of viewport

function scaleImage() {
  // Source image width and height to grab is canvas size divided by zoom level,
  // unless image size is already smaller than that
  var w = Math.min(img.width, Math.ceil(cnv.width / vpZoom));
  var h = Math.min(img.height, Math.ceil(cnv.height / vpZoom));

  // Set size of background canvas to match slice of source image to be grabbed
  bgCnv.width = w;
  bgCnv.height = h;
  // Draw image slice onto background canvas, vpOrigin is upper-left corner of slice
  bgCtx.drawImage(img, vpOrigin[0], vpOrigin[1], w, h, 0, 0, w, h);

  // We'll be working with pixel bytes, so get bytes for image slice and create
  // a larger image data object to hold scaled-up image
  var src = bgCtx.getImageData(0, 0, w, h);
  var dst = bgCtx.createImageData(w * vpZoom, h * vpZoom);

  var srcOffset = 0;
  var dstOffset = 0;

  // lineArray holds the current line of the source image stretched out horizontally
  var lineLength = 4 * w * vpZoom;
  var lineArray = new Uint8ClampedArray(lineLength);

  // For each line of the source image...
  for (var y = 0; y < h; y++) {
    var lineOffset = 0;
    // ...for each pixel on the current line...
    for (var x = 0; x < w; x++) {
      // Grab the four bytes representing the current pixel
      var byte = src.data.subarray(srcOffset, srcOffset + 4);
      // ...and append them vpZoom times to lineArray
      for (var n = 0; n < vpZoom; n++, lineOffset += 4) lineArray.set(byte, lineOffset);
      srcOffset += 4;
    }
    // Once lineArray is created, append it vpZoom times to the destination image object
    for (var n = 0; n < vpZoom; n++, dstOffset += lineLength ) {
      dst.data.set(lineArray, dstOffset);
    }
  }

  ctx.putImageData(dst, 0, 0);
}
Using this method, scaling now becomes zooming, the desired operation.

Of course, there are better ways to do this, and on a large image with a low zoom level this is much slower than native scaling. My hope is that CSS rules to do this natively improve and are incorporated into release versions of browsers.
EDIT
There was a much faster way to do nearest-neighbor scaling, which I adapted from this mozilla.org page. Since color information doesn't change, you can read 32-bit bytes out of the pixel array buffer. On my computer, scaling at slowest setting (2x) took about a fifth as long as the method above... your mileage may vary.
function scaleImage2() {
  var w = Math.min(img.width, Math.ceil(cnv.width / vpZoom));
  var h = Math.min(img.height, Math.ceil(cnv.height / vpZoom));
  bgCnv.width = w;
  bgCnv.height = h;
  bgCtx.drawImage(img, vpOrigin[0], vpOrigin[1], w, h, 0, 0, w, h);

  // We'll be working with pixel bytes, so get bytes for image slice and create
  // a larger image data object to hold scaled-up image
  var src = bgCtx.getImageData(0, 0, w, h);
  var dst = bgCtx.createImageData(w * vpZoom, h * vpZoom);

  // Since no colors will be altered, create 32-bit views into pixel buffer to read an
  // entire pixel at a time
  var srcPx = new Uint32Array(src.data.buffer);
  var dstPx = new Uint32Array(dst.data.buffer);

  var srcOffset = 0;
  var dstOffset = 0;

  // lineBuf holds the current line of the source image stretched out horizontally
  var lineLength = w * vpZoom;                   // lineLength is pixels per line of scaled image
  var lineBuf = new ArrayBuffer(lineLength * 4); // Array buffer needs to by 4x the size for RGBA
  var linePx = new Uint32Array(lineBuf);

  for (var y = 0; y < h; y++) {
    var lineOffset = 0;
    for (var x = 0; x < w; x++, srcOffset++) {
      // Append the current pixel vpZoom times to lineBuf's 32-bit view
      for (var n = 0; n < vpZoom; n++) linePx[lineOffset++] = srcPx[srcOffset];
    }
    // Once lineArray is created, append it vpZoom times to the destination image object
    for (var n = 0; n < vpZoom; n++, dstOffset += lineLength ) {
      dstPx.set(linePx, dstOffset);
    }
  }

  ctx.putImageData(dst, 0, 0);
}
No comments:
Post a Comment